
I was at a discussion or meeting a couple of weeks ago about one of my favourite topics – Assessment. The format was that representatives from 7 schools described where they were going with assessment and what problems they were grappling with. We looked at assessment policies and practices from the theoretical to the procedural. We looked at software systems and how they were used, how you put in data and got it out in a variety of different forms. The usual words were being used “Summative”, “Formative”, “Evidence”, “Reflection” and of course “Data”, when I began to notice that I understood different things by some of these words compared to the others. I explained that at the meeting in a rather haphazard way, but thinking about it since has crystallised the problem a bit more for me.
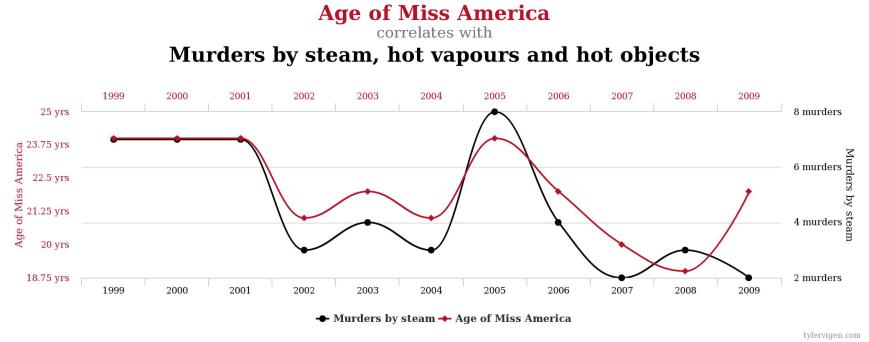
Some Spurious data from the wonderful tylervigen.com
My two main areas of concern are the use of the words “Data” and “Evidence”. I worry enormously about the way data is used whether it is big data, personalised data, averaged data, data-over-time, data-as-snapshot or data as the start of a conversation. The other schools in this conversation were all very keen to make it easy to put in lots of data. Systems are judged by the lack of impediment they create to a teacher putting in data. They were then very keen to use the data as much as possible. There were tables and graphs, coloured cells popping up on spreadsheets to indicate anomalous data, letters sent, meetings arranged, reports written and targets set on the basis of all this data.
Reading the news headlines of recent years should make us terribly wary of data. There is a whole profession of people whose expertise lies in collecting and drawing conclusions from data. They study in minute detail the best ways to collect accurate normed and unbiased data. They are not just a bunch of teachers whose real profession is teaching and who use a bit of data on the side to help them. No, these are the true data junkies. Unfortunately the evidence (that word again) indicates how unreliable this process is. They have got most major global predictions wrong. From the complete absence of a prediction of the 2008 crash, to the Trump and Cameron elections, to Brexit and Leicester City, the analysis of data has been completely wrong. Not just a bit wrong, but completely wrong. How wrong can you get a choice between win and lose?
So why aren’t we amateur data addicts a bit more worried about the way we use data? It is just too seductive isn’t it? After the meeting I described at the start, a colleague from another school said to me that he was surprised that I wasn’t so keen on using real data to describe progress, because I was a mathematician after all. Perhaps that is the problem. I have a romantic relationship with the products of mathematics. I love the processes. I can sit over tables on spreadsheets for hours as happy as the bunnies in the Fibonacci story. But, I can also see my lover’s faults! If you take a large bunch of numbers and perform some interesting and quite complex maths on them, you can produce conclusions. The main criterion for the value of the conclusions is the sophistication of the maths. The more complex, the more seductive. The second criterion is the quality of the presentation of the results. Colours and graphs, animations and alerts are just so persuasive. We often fail to question the nature of the data it has come from. Beautiful constructions from bad bricks still fall down.
A weather analogy. My colleagues were looking at students targets based on predicted grades. They had a wonderful system that showed up when the deviation of performance from expectation was large or significant. If performance was lower, then it clearly showed something was up. Red lights should flash. Alarms should ring. Reasons need to be found for the underperformance of the child. Note that it is always the underperformance of the child and not the overperformance of the prediction. If yesterday’s weather forecast had predicted a sunny day, but today turned out rainy, would we be looking to see why the day had underperformed? What is wrong with the day that it has failed to live up to its expectation? I suggest we are more likely to call the prediction into question than our observation of the weather. We would blame the weathermen or the Met office, or the website or the newspaper. They have got it wrong again. But with kids we would rather blame performance of the child than the inaccuracy of the prediction. Strange isn’t it.
So, does all this data really constitute evidence? I must come clean and say the correct answer is “Yes, but only a bit!”. If a child is graded and the grades go steadily down, we should try and find out why. If a whole class of children’s grades are going down we should try to find out why. But what we must not get sucked into doing is thinking that the grades are the complete picture of the child’s leaning, just because we can plot a graph. We should not think that this constitutes evidence of learning whether it goes up or down. Evidence is much more complex than that. These trends are evidence only of grades.
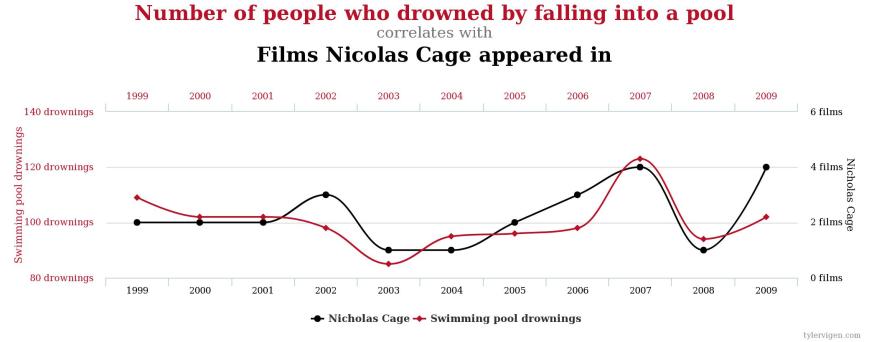
More correlation from tylervigem.com
Another weather analogy. Describe yesterday to me, from a weather point of view. Just have a think about what you would say if I asked you to describe the weather in a couple of sentences. You could do it couldn’t you? Now describe the weather yesterday in a number – just one. A bit harder? Will you give me the temperature, and if so at what time, or would it be an average? Or perhaps you would choose the hours of sun, or the millimetres of rain? The pollen count or the relative humidity? Difficult to imagine summing up the weather in one number isn’t it. So if we cannot sum up a day in one number, why do we attach such credibility to a lot of days summed up by a lot of numbers? A graph of average temperature over all of the days of a month is a collection of a lot of single days reduced to numbers, and no more than that. We can look at trends of course, and therein lies the power. But it is only the trend of a single number on a single day. The reduced encapsulation of a day into a number is no less a reduction of data just because we do it a lot.
Let’s take a step backwards. You gave me a couple of sentences to describe the weather yesterday and we probably happier with that than with any single number you produced. Even then, I wonder if it captured the whole of the glorious complex changing weather of the whole day. Did you catch all the subtle changes of light as the clouds move, the sun drops and moon appears? Did you capture the different nature of the rain as it moved from a few sporadic drops, accompanied by a drop in wind and a lowering of temperature, to a tumult that washed away the leaves left on the ground by the wind of the morning? The point I am trying to make is that we can only experience the whole day be being in the whole day. Anything else is a reduction. The same is true with a piece of student work. They may write an essay, paint a picture or write up an experiment. Any comment we make is a reduction from the complexity of the work. To reduce further to a number removes evidence rather than creates it.
With the weather we are unlucky. If you arrive in my town and I tell you that yesterday was a glorious day, you can never experience it. Not that exact day. It is gone. But in education we are largely very lucky indeed. A piece of student work usually still exists, and we can go back to it again and again. I say usually, because a performance is not usually the same. I unfortunately missed a play at my school last week due to some unavoidable meetings. I am told it was wonderful, but I will never see it. Shame!
Here is the nub of my concern. When my colleagues spoke about evidence they meant sets of numbers, and occasional comments that summed up some spurious reductionist data and had value only because we can draw pretty graphs. When I say evidence, I mean the work itself. That is where the evidence lies. Let us resolve never to reduce the glory of a child’s learning to a number, but look at the work itself and see that here is the evidence of the progression of his communication skills or her analytical skills. Let us never send to parents a number that we pretend describes their child unless we have shown them the piece of work in all its complexity, with all its strengths and weaknesses. Then we can engage in reflection on learning that actually means something.
Don’t try to encapsulate the development of Picasso’s artistic career in a set of numbers and pretend that it describes his art. We are often guilty of doing no more than the analysists who would do this by listing how much the paintings sell for. The cost of everything tells us the value of nothing.

Excellent article!
LikeLike
This is a very proactive and insightful review. I will share via Twitter!
LikeLike
Pingback: Collaboration, Group Work and the fulfillment of a grim philosophy. | Education Changes